Dissecting FITS files - The FITS extension & Astronomy
FITS is a very common extension used in astronomy.
It stands for Flexible Image Transport System.
Literally any image or spectrum produced by any observatory or telescope in this world (or orbiting this world) will eventually be converted from RAW CCD format into a FITS file! I still don't know how it caught on or what the advantages of the FITS extension are over the other types like .txt or .asc (ASCII) but hey, it's the convention and i'd (and any one interested in pursuing Astronomy seriously) should learn how to go about using FITS files i.e accessing them, understanding the data structure in a FITS file and performing operations on them.
Astronomical data is usually pictures in one color. Yes. Only one color.
Yes. Everything you know IS a lie. All of the colored pictures of nebulae, star forming regions, the galaxy and what not are actually false-color images where images of the same object observed at different wavelengths are clubbed together - stacked - to create a false color image. Usually the color red stands for a H Balmer emission line, green corresponds to OII lines (singly ionized oxygen) etc etc. Because the H Balmer lines are at lower energy i.e higher wavelength in comparison to the OII lines, it is convenient to represent emission from the H nebulae as red!
PS - you might run into notations like these HI, OIV, CIII] & [SIII] -
these are neutral hydrogen, triply ionized oxygen, the semi-forbidden transition in doubly ionized Carbon and a forbidden transition in doubly ionized Sulphur respectively.
Now, coming back to the point. Astronomical data. FITS extension files.
As i said, usually the contents of a file are an image. If you try opening a FITS file in a(ny) simple text editor, it will (eventually) open the file. You will see ASCII data on top of the file but everything after a point in the file will look like garbage. This is because of the structure of a FITS file.
A FITS file has a minimum of 2 components - The Header and The Data.
The Header in a FITS file will describe the instrument which generated the FITS file, when the image was taken, what the sky conditions were, instrument sensitivity, the data pipeline this FITS file was processed through and so on and so forth. Following this Header is the actual data, which is an n*n array representing an image where the value at each of the matrix's elements correspond to the flux at that particular element - i.e pixel.


The best software i've seen so far to be able to look at the structure of a file is fv by HERA .
All of the images above are of me using the software fv! The FITS file structure is graphically shown and easy to use as well. While automating the process of opening a large number of FITS files maybe a problem using fv, a general knowledge of the FITS data structure can be gained thanks to the software.
Moving on, while fv is not the most user friendly nor is it a treat to the user's eyes, it works if you are not going to work on FITS files for the rest of your file! One of the better and much more user-friendly software that can be used is DS9. If any of you people get the reference to Star Trek : Deep Space 9 and if you're wondering whether or not there is an actual connection, read this. Very user friendly, east to display images and easy to convert images into .TIFF, .JPEG or whatever other formats if needed! Again, it's a good software for small time use. But you will realize the full capabilities of DS9 if you start using it with IRAF!
Moving on, the FITS support office (yes, you read that right. FITS support office) handled by NASA-GSFC prescribes some other programs to view FITS files.
One of the options that i've tried is using WebHERA. It's a cloud based solution so you don't have to download and install anything on your system. Any file you'd like to open and explore can either be linked via the internet or uploaded from the system. There are tonnes packages that can be used to explore FITS files and do a gazillion operations but it is kind of hard to use. I won't even call it steep learning curve because it's a curve i don't want to be on top of! I don't even want to bother climbing!
The web interface works on a pop-up window. It keeps refreshing your access every ~10 mins (or maybe it just happened with me!) and you'll have to start your work all over again if you aren't done working within 10 mins.
So, i went in search of more tools to open, explore and use FITS files.
I came across the Virtual Observatory India tools - VOCon and ConVOT - two programs written in java that can be used to access FITS files. They are v0.9 and v1.0 of the same software (i don't know why they changed the name though) and they work perfectly fine for small FITS files that contain images. The FITS files i'm working on contain spectra of objects. Whole different league! And neither of these were able to decipher it and throw some light on the internal structure. But hey, as i said, these work perfectly fine for FITS files containing imaging data or polarimetric data - not spectroscopic data! This also has a graphical windows displaying data from the FITS file, sort of like how fv does it. Also, they can be used to convert FITS files into ASCII files and vice-versa! In one of the versions of the software, you an even convert them into a format VOTable!
And well, there ended the search for programs with a graphical interface to open and use FITS files. And either way, i had to work with a lot of FITS files. Like a lot. So, sometime or the other in the course of my project, i had to automate the process of working on FITS files - the beginning of which is opening the FITS file, extracting useful/necessary information and dump this into a txt or ASCII file!
So, libraries that can be used in programming languages!
Again, the FITS support center comes to the rescue with a list of libraries for use in various languages - C, Python being the ones i prefer working with. I will eventually use the Matlab and Mathematica libraries as well but for now the CFITSIO library and the PyFITS libraries are the easiest and best i've used! They're easy to install - especially in ubuntu via synaptic package manager - and detailed documentation will help you through using it! A very very concise and awesome Python script is given in the SDSS DR9 Tutorials page. Obviously there are some small changes to be made when you are dynamically typing out these commands, especially to the pyfits.open('') dialogue but hey, i'm sure you should be able to figure it out. The PyFITS documentation page is again extremely helpful.
So, there you are. Short term and Long term tools that can be used to work with FITS files.
It stands for Flexible Image Transport System.
Literally any image or spectrum produced by any observatory or telescope in this world (or orbiting this world) will eventually be converted from RAW CCD format into a FITS file! I still don't know how it caught on or what the advantages of the FITS extension are over the other types like .txt or .asc (ASCII) but hey, it's the convention and i'd (and any one interested in pursuing Astronomy seriously) should learn how to go about using FITS files i.e accessing them, understanding the data structure in a FITS file and performing operations on them.
Astronomical data is usually pictures in one color. Yes. Only one color.
Yes. Everything you know IS a lie. All of the colored pictures of nebulae, star forming regions, the galaxy and what not are actually false-color images where images of the same object observed at different wavelengths are clubbed together - stacked - to create a false color image. Usually the color red stands for a H Balmer emission line, green corresponds to OII lines (singly ionized oxygen) etc etc. Because the H Balmer lines are at lower energy i.e higher wavelength in comparison to the OII lines, it is convenient to represent emission from the H nebulae as red!
PS - you might run into notations like these HI, OIV, CIII] & [SIII] -
these are neutral hydrogen, triply ionized oxygen, the semi-forbidden transition in doubly ionized Carbon and a forbidden transition in doubly ionized Sulphur respectively.
Now, coming back to the point. Astronomical data. FITS extension files.
As i said, usually the contents of a file are an image. If you try opening a FITS file in a(ny) simple text editor, it will (eventually) open the file. You will see ASCII data on top of the file but everything after a point in the file will look like garbage. This is because of the structure of a FITS file.
A FITS file has a minimum of 2 components - The Header and The Data.
The Header in a FITS file will describe the instrument which generated the FITS file, when the image was taken, what the sky conditions were, instrument sensitivity, the data pipeline this FITS file was processed through and so on and so forth. Following this Header is the actual data, which is an n*n array representing an image where the value at each of the matrix's elements correspond to the flux at that particular element - i.e pixel.

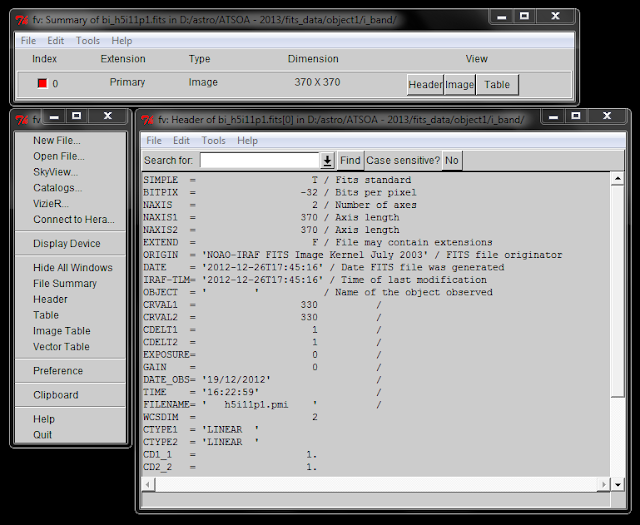
The structure of an Image FITS file. There is one header which contains basic information about image and then there's an array representing the image!

(see?! the picture is just different shades of red!)

The structure of a spectrum of an object.
Things are more complicated here.
9 blocks in total, the 0th, 1st and 3rd blocks here are of significance here as the 0th block is the primary header, the 1st block is the actual spectrum data - flux vs wavelength
Things are more complicated here.
9 blocks in total, the 0th, 1st and 3rd blocks here are of significance here as the 0th block is the primary header, the 1st block is the actual spectrum data - flux vs wavelength
and the 3rd block is a list of all the atomic lines the data processing pipe line looked for in this specific spectrum.
Note, these might not be found in this specific spectrum but these are the more common lines found in quasar spectra - sort of a template.

the primary header

Header to the block containing the data of the spectrum - as you can see from the header!

spectrum data - flux vs log(wavelength) (and other variables)

how the spectrum actually looks

How the template file looks
The best software i've seen so far to be able to look at the structure of a file is fv by HERA .
All of the images above are of me using the software fv! The FITS file structure is graphically shown and easy to use as well. While automating the process of opening a large number of FITS files maybe a problem using fv, a general knowledge of the FITS data structure can be gained thanks to the software.
Moving on, while fv is not the most user friendly nor is it a treat to the user's eyes, it works if you are not going to work on FITS files for the rest of your file! One of the better and much more user-friendly software that can be used is DS9. If any of you people get the reference to Star Trek : Deep Space 9 and if you're wondering whether or not there is an actual connection, read this. Very user friendly, east to display images and easy to convert images into .TIFF, .JPEG or whatever other formats if needed! Again, it's a good software for small time use. But you will realize the full capabilities of DS9 if you start using it with IRAF!
Moving on, the FITS support office (yes, you read that right. FITS support office) handled by NASA-GSFC prescribes some other programs to view FITS files.
One of the options that i've tried is using WebHERA. It's a cloud based solution so you don't have to download and install anything on your system. Any file you'd like to open and explore can either be linked via the internet or uploaded from the system. There are tonnes packages that can be used to explore FITS files and do a gazillion operations but it is kind of hard to use. I won't even call it steep learning curve because it's a curve i don't want to be on top of! I don't even want to bother climbing!
The web interface works on a pop-up window. It keeps refreshing your access every ~10 mins (or maybe it just happened with me!) and you'll have to start your work all over again if you aren't done working within 10 mins.
So, i went in search of more tools to open, explore and use FITS files.
I came across the Virtual Observatory India tools - VOCon and ConVOT - two programs written in java that can be used to access FITS files. They are v0.9 and v1.0 of the same software (i don't know why they changed the name though) and they work perfectly fine for small FITS files that contain images. The FITS files i'm working on contain spectra of objects. Whole different league! And neither of these were able to decipher it and throw some light on the internal structure. But hey, as i said, these work perfectly fine for FITS files containing imaging data or polarimetric data - not spectroscopic data! This also has a graphical windows displaying data from the FITS file, sort of like how fv does it. Also, they can be used to convert FITS files into ASCII files and vice-versa! In one of the versions of the software, you an even convert them into a format VOTable!
And well, there ended the search for programs with a graphical interface to open and use FITS files. And either way, i had to work with a lot of FITS files. Like a lot. So, sometime or the other in the course of my project, i had to automate the process of working on FITS files - the beginning of which is opening the FITS file, extracting useful/necessary information and dump this into a txt or ASCII file!
So, libraries that can be used in programming languages!
Again, the FITS support center comes to the rescue with a list of libraries for use in various languages - C, Python being the ones i prefer working with. I will eventually use the Matlab and Mathematica libraries as well but for now the CFITSIO library and the PyFITS libraries are the easiest and best i've used! They're easy to install - especially in ubuntu via synaptic package manager - and detailed documentation will help you through using it! A very very concise and awesome Python script is given in the SDSS DR9 Tutorials page. Obviously there are some small changes to be made when you are dynamically typing out these commands, especially to the pyfits.open('') dialogue but hey, i'm sure you should be able to figure it out. The PyFITS documentation page is again extremely helpful.
So, there you are. Short term and Long term tools that can be used to work with FITS files.