Posts

Showing posts from June, 2013

Dissecting FITS files - The FITS extension & Astronomy
Image
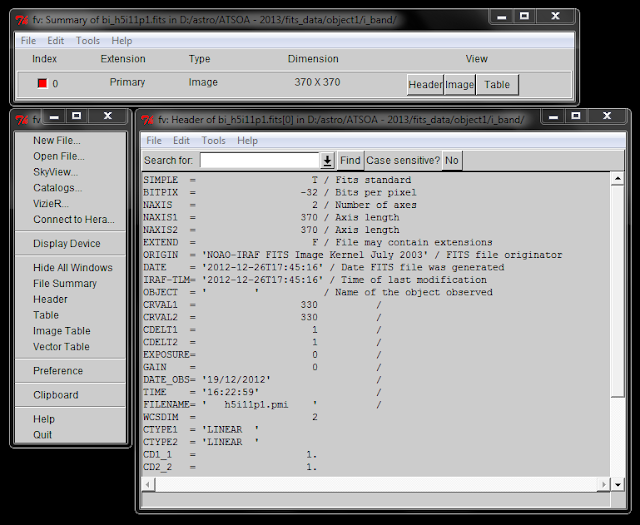
FITS is a very common extension used in astronomy. It stands for Flexible Image Transport System. Literally any image or spectrum produced by any observatory or telescope in this world (or orbiting this world) will eventually be converted from RAW CCD format into a FITS file! I still don't know how it caught on or what the advantages of the FITS extension are over the other types like .txt or .asc (ASCII) but hey, it's the convention and i'd (and any one interested in pursuing Astronomy seriously) should learn how to go about using FITS files i.e accessing them, understanding the data structure in a FITS file and performing operations on them. Astronomical data is usually pictures in one color. Yes. Only one color.  Yes. Everything you know IS a lie. All of the colored pictures of nebulae, star forming regions, the galaxy and what not are actually false-color images where images of the same object observed at different wavelengths are clubbed together - stacked - to

3 Projects i need help with

I've wanted to learn methods to Extract and Visualize data and i've come up with 3 projects that i could use to learn these methods! I've been working on them for a couple of months now, doing background work to remove all of the trivial problems! Mining my blog, Mining Facebook Data and Mining my bookmarks - these are the three projects i have in mind and i need help with. Mining my blog If you guys don't know, i have another blog which automatically posts videos i add to my Youtube Favorites list - using IFTTT . I've been using this service for over an year now and i have ~600 posts - all of them videos on my blog. Now, i want to mine the blog to look at the frequency with which i watch youtube videos, maybe see a pattern which i can correlate to my college exam schedule! While looking for ways to mine the blog, i found out that i can download my blog as an xml file! So, getting the data part is taken care of. Here's the xml file. Download it and op

Week 3 - PYTHON!!! and Data Analysis.

Image
Yes. The exclamation marks, all of three of them are necessary! Because i cannot tell you in words how blown away i am having used python for the last week. Don't get me wrong, i've used/tried python before, learning for a couple of days but eventually abandoning it! And the reason i love (yes, love. not just like. ever-lasting love) it so much is because of what i've been able to accomplish. Before i start with what happened this week, I'm sure there are ways to do the same using other programming languages : C, Java, Mathematica and what not but they (probably) don't have the extremely extensive documentation and gazillions of examples. So, as I said last week , my work for the summer was the reproduce the results of a certain paper by Richards, Gordon T (2000) which analyses the color-redshift relation of 2625 quasars. I've extensively explained the details of the paper and the results i am to reproduce in last week's post. And as i said, last week en

Week 2 - Data Mining & Colors of a Quasars

Image
So, here's what i'm working on. I'm reproducing a paper published in 2000 by Richards et al on the colors of 2625 quasars at red shifts ranging from 0<z<5 and the empirical relation between color and red shift of a quasar. I don't know how much of that you understand but well, that's my work for the summer. Let me now break down it down. The color of a quasar is the difference in the (AB) magnitude of a quasar in different bands - u, g, r, i, z to be specific in the case of the SDSS . The definition of color in this case is no different than what you and I use everyday to describe objects. Refer to this awesome comic by the oatmeal .   The color receptors mentioned in the comic are specifically sensitive to the R, G & B bands, which is why they are our primary colors. For humans specifically. Now, we do something similar here - take a CCD (which is our brain) and fit it with 5 (instead of just 3) filters (which are u, g, r, i, z for the SDSS). Ligh

Week 1 - Quasars.

What I haven't told you guys is, I'm in Trivandrum, Kerela right now. I've been here since last friday. I am currently a Summer Intern at IIST, Trivandrum   under Prof. Anand Narayan of the Earth & Space Sciences Dept here at IIST.  I'm working on Astrophysics. To be more specific, i'm working on Quasars, understanding their spectra and the processes involved behind their extreme luminosity. I will give a much more detailed account of the work I've been doing for the last week but let me summarize here what I've experienced here at IIST.  If stepping off the train at Trivandrum to the song It's a long way to the top by AC/DC   wasn't enough of a signal, it started to rain the minute i stepped out the train onto trivandrum. Well you could say that it's the rainy season and that it rains in trivandrum a lot but let me remind you that the day i got off the train was on the 31st May, coincidentally the 1st day of this year's monsoon in Ke