Photometry
There is only so much once can infer from qualitative study of stars and other astronomical objects that at some point or the other, a much more detailed quantitative study of these objects is necessary - to get a better understanding of various properties such as the luminosity of a star, the spectral features of a star, chemical composition of a star etc
One such property of various astronomical objects is their magnitudes in various filters or various bands and the corresponding colors of these objects. Since studying the flux i.e strength of emissions at each and every wavelength is a lengthy and time consuming task, we study the emission over a wavelength range constricted by bands.
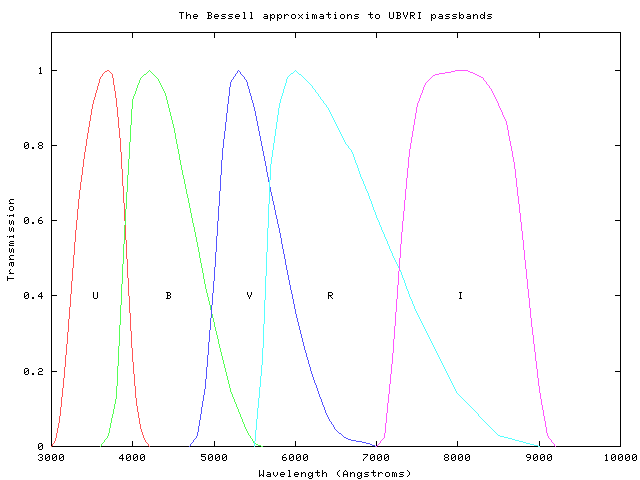
For example, we humans can perceive color in 3 color bands - R, G, B and by varying the strength of emissions in these 3 bands, we can create the full spectrum of colors. Similarly, while observing astronomical objects, we use specific bands and quantify the emission of the object in these specific bands to understand it better. For example, the most popular and widely used filters are the Johnsons' filters - U, B, V, R, I and the Johnsons' Cousins filters - J, H, K and so on. These bands cover a wavelength range starting from 3000 A - the U band to 9000 A - the I band and then moving into the IR range i.e 1μ m - the J band to 10μ m - the K band. These bands have a width of ~1500 A and usually have a transmittivity in the range of ~ 0.4-0.7. You can see the exact shapes and transmittivity of the johnsons' filters in the following picture -

source
Moving further, colors are defined as the difference between the magnitudes of an object in two consecutive bands. There are different ways to define magnitudes in astronomy - the most common ones being the apparent magnitude -m and absolute magnitudes - M . As for colors, MU−MB,MB−MV,MV−MR,MR−MI are some examples if we use the johnsons' filters. Here MU is the absolute magnitude of the object in the U band. We have chosen just 4 of the 10 possible combinations between the 5 bands available for the sake of resolution. We are studying an object's properties over bands and not at each and every wavelength because it's arduous and time consuming, which is what spectroscopy is. But, we would still like to get a feel of how the spectrum of the object varies from 3000 A - 9000 A i.e the observable range. If MU−MB is greater than 0 , then we would know that the object is bluer. If the value is less than zero, the object is redder. Similarly with the other 3 colors. And we could in practice derive the rest of the 6 colors from these 4 colors! But, as i said, we choose these 4 for the sake of spectral resolution.
There you go, we've been able to quantify an astronomical object's luminosity in various bands using apparent & absolute magnitudes and by using the 4 colors derived from the absolute magnitudes.
Some interesting trivia worth mentioning here is the story of the H-R diagram i.e the Hurtzprung-Russell diagram. The H-R diagram is a remarkable tool to estimate the age, luminosity, temperature and mass of any star.
Here is what one version of the HR diagram looks like

source
and here's a different version.

source
The original HR diagram is the latter one - the one where luminosity in terms of solar luminosityLo is plotted against MB−MV . You might be wondering why the temperature scale in the first plot is inverted - the x axis has temperature decreasing. This is because with decreasing T, the value of MB−MV increases. As is said, the second plot was the original plot and the relation between the temperature of a star and the color was quantified much later. And hence, to preserve the shape of the HR diagram, the newer version of the plot has temperature decreasing from the left to the right.
The H-R diagram is a treasure trove of information. You can read further about the H-R diagram, what properties of a star can be inferred from the H-R diagram and so on here.
We also have color-color plots which help us understand and distinguish between white dwarfs, giants, main sequence stars and what-not.
So, there you go, quantifying the luminosity of a star has helped us understand the relationship between the luminosity of a star and it's temperature, the color of a star and it's age. There is a lot more than can be inferred but well for now, let me stop here.
Questions & Comments are welcome and are highly appreciated.
One such property of various astronomical objects is their magnitudes in various filters or various bands and the corresponding colors of these objects. Since studying the flux i.e strength of emissions at each and every wavelength is a lengthy and time consuming task, we study the emission over a wavelength range constricted by bands.
For example, we humans can perceive color in 3 color bands - R, G, B and by varying the strength of emissions in these 3 bands, we can create the full spectrum of colors. Similarly, while observing astronomical objects, we use specific bands and quantify the emission of the object in these specific bands to understand it better. For example, the most popular and widely used filters are the Johnsons' filters - U, B, V, R, I and the Johnsons' Cousins filters - J, H, K and so on. These bands cover a wavelength range starting from 3000 A - the U band to 9000 A - the I band and then moving into the IR range i.e 1
source
Moving further, colors are defined as the difference between the magnitudes of an object in two consecutive bands. There are different ways to define magnitudes in astronomy - the most common ones being the apparent magnitude -
There you go, we've been able to quantify an astronomical object's luminosity in various bands using apparent & absolute magnitudes and by using the 4 colors derived from the absolute magnitudes.
Some interesting trivia worth mentioning here is the story of the H-R diagram i.e the Hurtzprung-Russell diagram. The H-R diagram is a remarkable tool to estimate the age, luminosity, temperature and mass of any star.
Here is what one version of the HR diagram looks like
Lo vs T
source
and here's a different version.
Lo vsMB−MV
source
The original HR diagram is the latter one - the one where luminosity in terms of solar luminosity
The H-R diagram is a treasure trove of information. You can read further about the H-R diagram, what properties of a star can be inferred from the H-R diagram and so on here.
We also have color-color plots which help us understand and distinguish between white dwarfs, giants, main sequence stars and what-not.
So, there you go, quantifying the luminosity of a star has helped us understand the relationship between the luminosity of a star and it's temperature, the color of a star and it's age. There is a lot more than can be inferred but well for now, let me stop here.
Questions & Comments are welcome and are highly appreciated.
Written with StackEdit.