Posts

Showing posts with the label sdss

Quasars - An Overview

Image
I promise, this is the last post on quasars. I'll move on after this one!  This post is an attempt to consolidate my summer work and explain it in easier terms - better than how my posts have been so far. So, any comments on the writing style or any questions are welcome.  so, moving on...  What are Quasars?!  Quasars are super massive black holes at the center of galaxies. These black holes are what are called active black holes - they feed on the surrounding gas and dust in the galaxy and emit radiation! You might then ask "Don't all galaxies have black holes at their center?". Damn right, they do. But these are inactive galaxies - because there isn't any (more) free gas lying around for the black hole to feed on. You see, over the course of evolution of a galaxy, gas starts to condense to form stars. So, a very young galaxy with a super massive black hole is what we are calling a Quasar. Quasars are categorized under AGN - Active Galactic Nuclei. The oth...

Animation using GNUPlot

Image
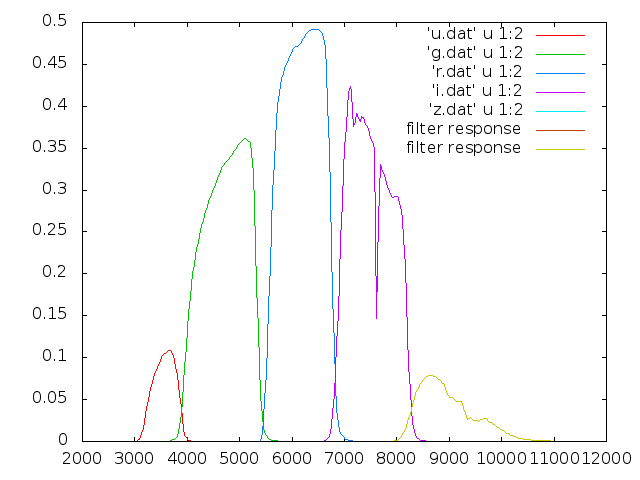
Animation using GNUPlot I've been trying to create an animation depicting a quasar spectrum moving across the 5 SDSS pass bands with respect to redshift. It is important to visualise what emission lines are moving in and out of bands to be able to understand the color-redshift plots and the changes in it. I've tried doing this using the animate function in matplotlib, python but i wasn't able to make it work - meaning i worked on it for a couple of days and then i gave up, not having found solutions for my problems on the internet. And then i came across this site, where the gunn-peterson trough and the lyman alpha forest have been depicted - in a beautiful manner. And this got me interested in using js and d3 to do the animations and make it dynamic - using sliders etc. In the meanwhile, i thought i'd look up and see if there was a way to create animations in gnuplot and whoopdedoo, what do i find but nirvana! In the image, you see 5 static curv...

Week 8 - Quasars & Future work

Image
Well, i'm back in chennai again, back at IIT Madras and back to, let's say, a *normal* college life. But I'm still interested in following what i started last summer. As you can see from my report here, and the blog posts from my previous weeks - I've mostly reproduced results from the first paper on my list - Richards et al. (2001) . The next papers on the list are on Photometric Redshifts of Quasars by Richards et al (2001), Composite Quasar Spectrum from the SDSS by Vanden Berk et al (2001) and Simulated colors of objects in the SDSS color space by Fan et al (1999).   All three of these papers feed off one another and complement each other!  A composite quasar spectrum i used to simulate the colors of a quasar at various redshifts - inorder to do this we need the band structures of the 5 bands - u, g, r, i, z of the SDSS. These can be obtained here . The loop side though is that this data is from 2001 and i haven't been able to find a more rece...

Colors of Quasars- Data Acquisition and Analysis

Image
Over the course of my project, i've had to work with multiple data sets. Two of the important data sets were the original data set used by Richards et al in their paper and a new data set that i acquired - data set whose samples are constrained by the same conditions as mentioned in the richards et al paper. Part of the original data used in the paper can be acquired from browsed from the vizier archived data , SIMBAD object list and NED object list . These data sets can be found through a simple search for the paper on SAO/NASA ADS. As mentioned, this is just a part of the original data set i.e data pertaining to only 898 of the 2625 quasars used in the original paper are available for download through these links. The location for the rest of the sample set is still elusive - maybe they were released as part of the SDSS Data Release 1 which is why they weren't specifically included in this data set. This conclusion is based on the fact that none of these 898 objects a...